
There is a structural property present in certain markets that is rarely acknowledged directly, and almost never understood in full. It is not visible through transaction frequency. It does not emerge from short-term price movements. It cannot be inferred from surface-level comparisons.
It reveals itself only when one steps back from activity and examines distribution.
At first glance, most markets appear to function through balance. Buyers and sellers meet, transactions occur, prices adjust, and over time an equilibrium seems to form. This perception is reinforced by the language used to describe markets—efficiency, liquidity, price discovery. Each of these terms suggests a system that is responsive, adaptive, and ultimately self-correcting.
But there are markets where this interpretation fails.
Not because they lack structure, but because their structure is fundamentally asymmetric.
The shape of value
Graph 1 – Lorenz Curve
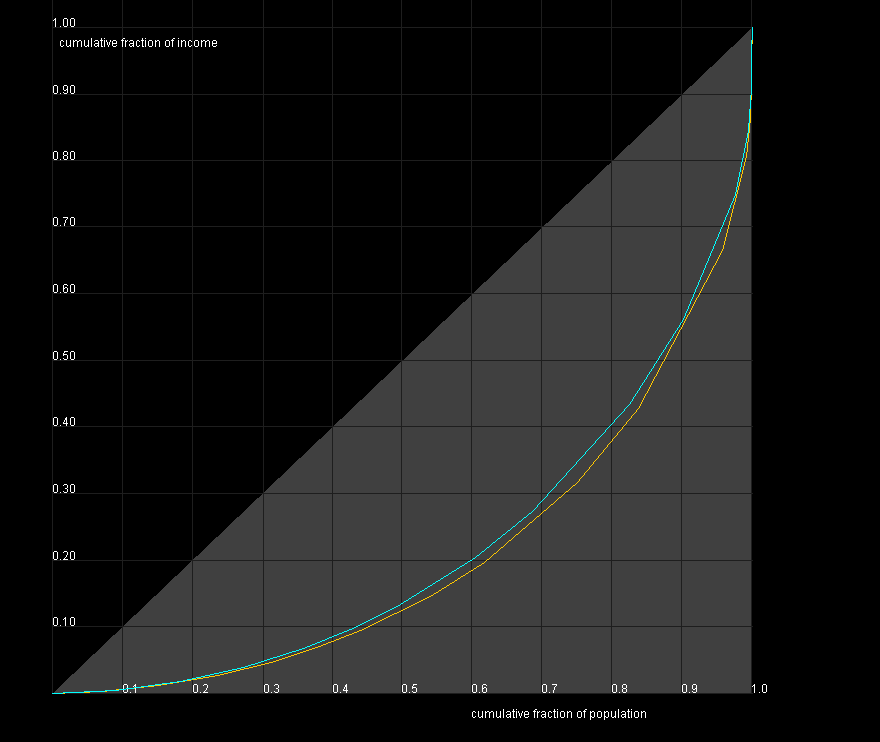
The Lorenz curve, shown above, is not a pricing model. It is not predictive. It does not attempt to estimate future outcomes. Instead, it describes how value is distributed across a system.
If value were evenly distributed, the curve would follow a straight diagonal line. Each incremental unit would contribute proportionally to the whole. The system would be balanced, predictable, and easily interpretable.
But that is not what we observe.
The curve bends. It departs from equality. A small portion of the system accounts for a disproportionate share of value, while the majority contributes relatively little.
This is not an imperfection. It is a defining characteristic.
And once this is understood, the behavior of the market begins to make sense.
Why most observations are misleading
In a system where value is concentrated, the majority of observable activity occurs in the least significant segment.
This is not because the market is inefficient, but because it is structured in such a way that lower-value assets are more numerous and more frequently exchanged. They generate data. They create comparables. They produce a sense of continuity.
Participants rely on these observations because they are available.
But availability is not the same as representativeness.
When most transactions occur in the lower portion of the distribution, the resulting data reflects that portion disproportionately. It creates the impression that the market is defined by what happens most often.
In reality, the market is defined by what contributes most of the value.
This disconnect between observation and structure is the source of persistent misinterpretation.
The center that is not in the middle
In a symmetrical system, the center of value lies near the center of activity. Median outcomes approximate typical outcomes. Deviations are limited. The system is intuitive.
In a concentrated system, this is no longer true.
The “center” of value is displaced. It resides in the upper segment of the distribution, where activity is sparse but impact is large. The median no longer represents the system. It represents only the most common outcomes, not the most important ones.
This creates a paradox.
The part of the market that matters most is the part that is seen least.
Liquidity and the appearance of understanding
Liquidity is often treated as a signal of market health. When transactions increase, it is interpreted as validation. When activity declines, it is seen as weakness.
This interpretation is appealing because it aligns with observable behavior. It provides a simple framework: more activity implies more interest, and more interest implies more value.
But this framework assumes that activity and value move together.
They do not.
Graph 2 — Price and Volume

The divergence between activity and value
The second graph illustrates a phenomenon that occurs repeatedly across markets.
Volume—representing activity—can increase independently of price. In some cases, it rises sharply while price remains flat or even declines. In other cases, price increases while volume remains subdued.
These divergences are not anomalies. They are indicators that different forces are at work.
Volume reflects participation. It captures how many transactions are occurring, how frequently assets change hands, and how engaged the market appears.
Price reflects agreement. It emerges when buyers and sellers converge on a valuation, which is influenced not only by current conditions but by expectations, scarcity, and context.
When volume and price diverge, it reveals that participation and valuation are no longer aligned.
Why divergence persists
In markets with continuous liquidity, divergences between price and volume tend to resolve quickly. Arbitrage mechanisms, transparent pricing, and constant participation bring the system back into alignment.
In less liquid environments, divergences can persist.
Activity can increase due to narrative, speculation, or repositioning, without a corresponding increase in underlying value. Conversely, value can increase quietly, without attracting widespread participation.
This persistence creates opportunities—but only for those who understand the structure.
The role of perception
Perception plays a central role in how markets are interpreted.
Participants are drawn to what is visible. Frequent transactions, rising volumes, and active marketplaces create a sense of engagement. They suggest that something is happening, and that what is happening is meaningful.
But perception is shaped by exposure.
What is seen often appears important, not because it is inherently so, but because it is reinforced repeatedly.
This creates a feedback loop.
Visibility leads to attention. Attention leads to interpretation. Interpretation reinforces the belief that what is visible is what matters.
But in a concentrated system, this loop is misleading.
The mispricing mechanism
When participants rely on visible activity as a proxy for value, they begin to misprice assets that do not conform to that activity.
Assets that transact frequently are easier to evaluate. They have comparables. They have recent sales. They fit within the observable framework.
Assets that transact infrequently are more difficult to assess. They lack recent data. They resist comparison. They appear uncertain.
As a result, the former are often priced more confidently, while the latter are priced conservatively—or ignored entirely.
This leads to systematic undervaluation of the most significant assets in the system.
Time as a corrective force
In markets where mispricing can persist, time becomes a critical factor.
Short-term activity reflects current perception. It is influenced by sentiment, narrative, and immediate conditions. It can change quickly.
Long-term value reflects structure. It is influenced by scarcity, relevance, and irreplaceability. It changes slowly.
Over time, these two dimensions interact.
Perception adjusts. Recognition occurs. Transactions reveal underlying value that was previously obscured.
But this process is not continuous. It occurs in discrete moments.
And between those moments, the market can appear disconnected from its own structure.
The quiet accumulation of significance
Assets that reside in the upper portion of the distribution do not require constant validation.
Their value is not dependent on frequent transactions. It does not fluctuate with daily activity. It is anchored in properties that are not easily replicated.
As a result, they tend to accumulate significance quietly.
They are held, not traded. They are recognized, not discovered. Their value is realized intermittently, not continuously.
To those focused on activity, this appears as inactivity.
To those focused on structure, it is stability.
What must be understood
To interpret such a market correctly, one must shift perspective.
Instead of asking what is happening most often, one must ask what contributes most of the value.
Instead of focusing on activity, one must examine distribution.
Instead of relying on liquidity as confirmation, one must understand its limitations.
This requires a different set of principles:
- Value is concentrated, not evenly distributed
- Visibility is not a reliable indicator of importance
- Activity reflects participation, not necessarily significance
- Time is required for structure to reveal itself
These principles are not intuitive, but they are consistent.
The cost of misunderstanding
When the structure of value is misunderstood, the consequences are predictable.
Participants overemphasize activity. They seek validation through transactions. They anchor expectations to what is most visible. They adjust positions based on short-term signals.
In doing so, they align themselves with the lower portion of the distribution.
They operate where the market is most active, but least significant.
And they miss the part of the system that defines it.
The advantage of clarity
Those who understand the structure operate differently.
They are not dependent on constant activity. They do not require continuous validation. They are willing to remain inactive when necessary, because they understand that inactivity does not imply absence of value.
They focus on position within the distribution, not frequency of transaction.
They recognize that the most important part of the market is not the part that moves most often, but the part that matters most when it does.
Conclusion
Markets are often described as mechanisms of discovery.
But discovery depends on what is being observed.
If observation is limited to activity, then activity becomes the measure. If observation extends to structure, then structure becomes the guide.
The Lorenz curve reveals that value is not evenly distributed. The divergence between price and volume shows that activity does not define value.
Together, they point to a deeper reality.
The center of the market is not where most transactions occur.
It is where most value resides.
And that center is often hidden.