
Valora Maxima Domain Index (VMDI)
A structured benchmark designed to measure price movements across key segments of the secondary domain market.
Market Commentary — March 2026
Index Performance Table
All values indexed to base period.
| Series | Index | Price | 1M | 12M |
|---|---|---|---|---|
| VMDI Composite | 109.95 | $6,077 | -0.24% | 4.08% |
| VMDI Broad | 102.33 | $3,554 | 0.95% | -2.92% |
| VMDI Premium 10 | 92.76 | $37,169 | -6.31% | 5.47% |
| VMDI .COM+ | 97.81 | $5,485 | -3.82% | -0.68% |
| VMDI Regional | 66.23 | $4,342 | -4.60% | 8.33% |
| VMDI Tech | 259.44 | $11,186 | 15.12% | 21.92% |
| VMDI Top 1 | 136.01 | $184,711 | -28.65% | -31.76% |
| VMD Liquidity Measure | $63M | 0.67% | 33.36% | >
- Price means Implied Average Price in US$
- Base value = 100 at inception date: March, 2020
- Universe: ≥$2,000 sales, lengths 5–12, alpha-only, Top 1% excluded
- Groups: .COM+, Regional, Tech
- Length-normalized (equal weight per length bucket)
- Minimum 5 transactions per length required
- Composite: weighted by predefined group weights (.COM+: 80%; Regional: 8% & Tech: 12%)
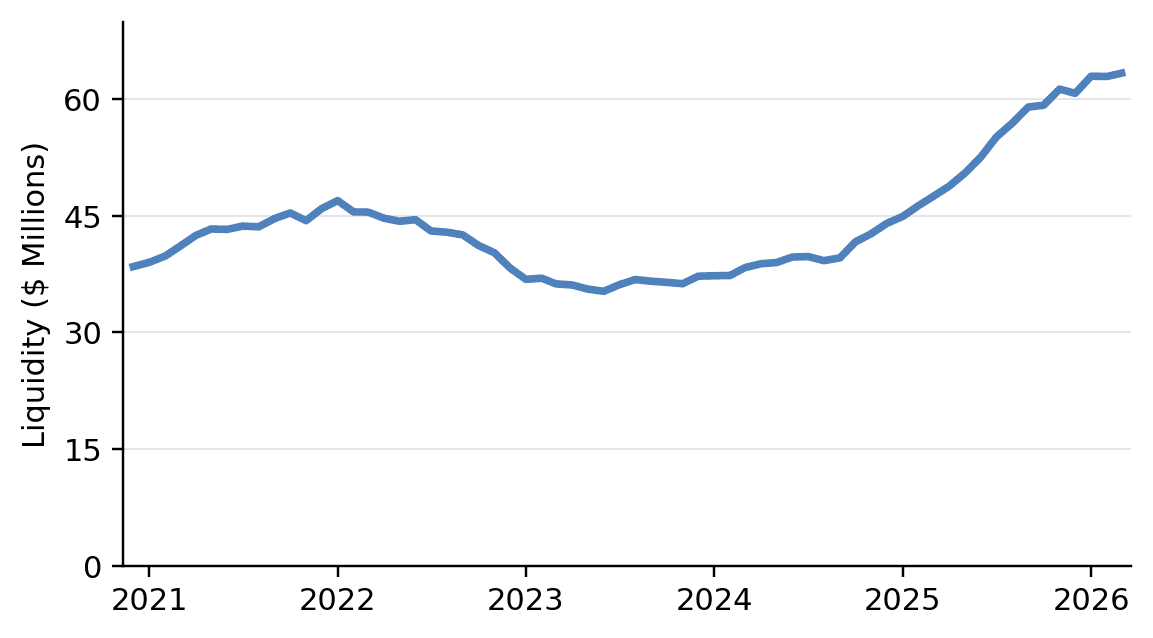
- VMD Liquidity Measure: Past 12-month total dollar volume of domain sales in the index universe
Key Charts
Charts reflect indexed values and rolling measures based on the VMDI methodology.
Data & Limitations
The index is derived from publicly available domain transaction data. While every effort is made to ensure consistency and accuracy, the dataset is not exhaustive and may not capture all private transactions.
Subscriber Access: Full multi-year performance metrics and structural analysis are available to subscribers.
Disclaimer
This report is provided for informational purposes only and does not constitute investment advice. The Valora Maxima Domain Index is an independent analytical construct and should not be relied upon as the sole basis for investment decisions.
© Valora Maxima — All rights reserved.
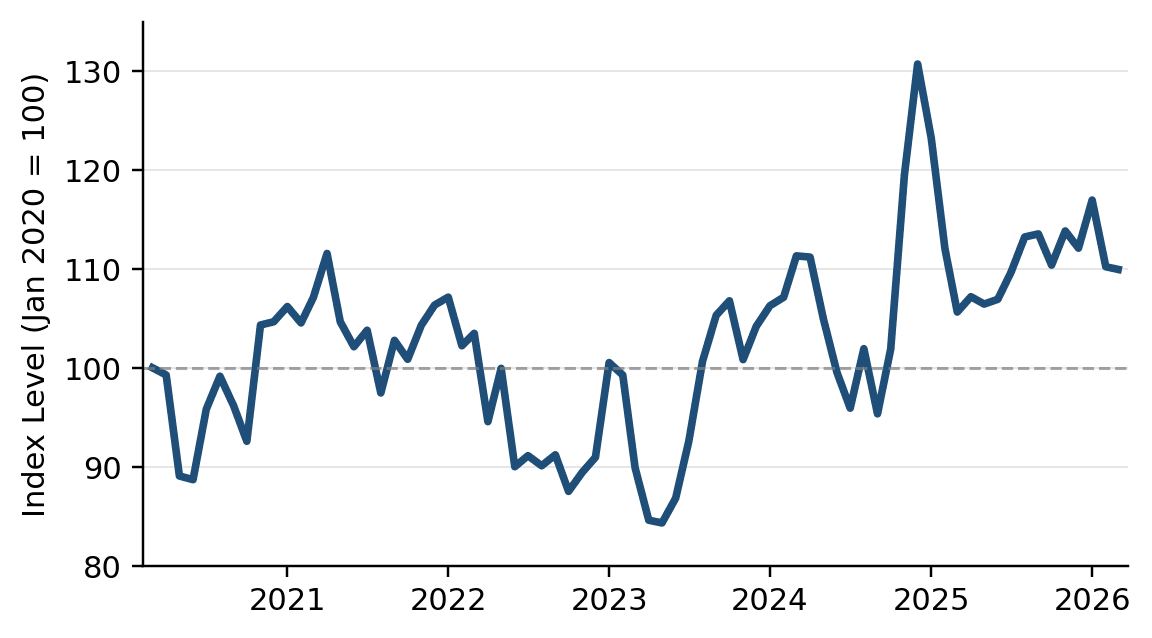
The Valora Maxima Domain Indices (VMDI) were broadly stable in March, with the VMDI Composite Index declining modestly by 0.24% to 109.95. Despite this marginal monthly movement, the Composite Index remains 4.08% above its level of a year earlier, indicating that the broader secondary domain market continues to retain much of the ground gained over the past twelve months.
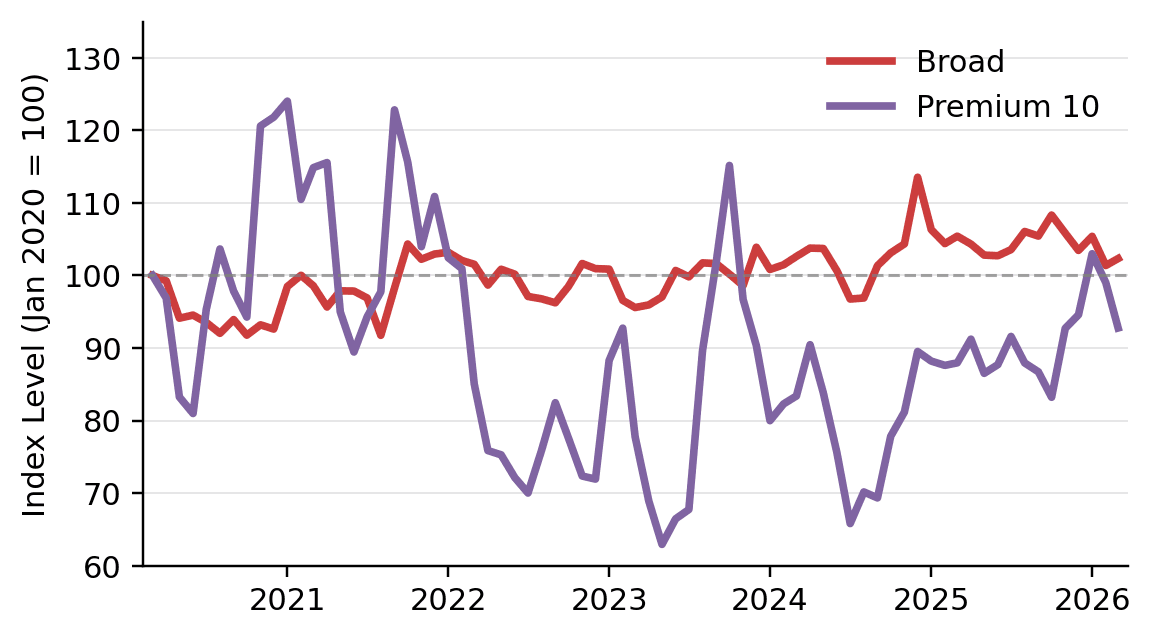
Beneath the surface, performance was mixed across segments. The broad market remained relatively stable, while higher-tier domains showed some softness following earlier strength. This pattern suggests a modest cooling at the upper end of the market rather than a generalized decline across all segments.
Segment-level dynamics were similarly uneven. The VMDI Tech Index showed strength during the month and remains elevated relative to its level a year earlier. By contrast, both the .COM+ and Regional segments declined, pointing to softer pricing conditions in those areas. Overall, the market appears increasingly selective, with capital shifting between segments rather than exiting the asset class.
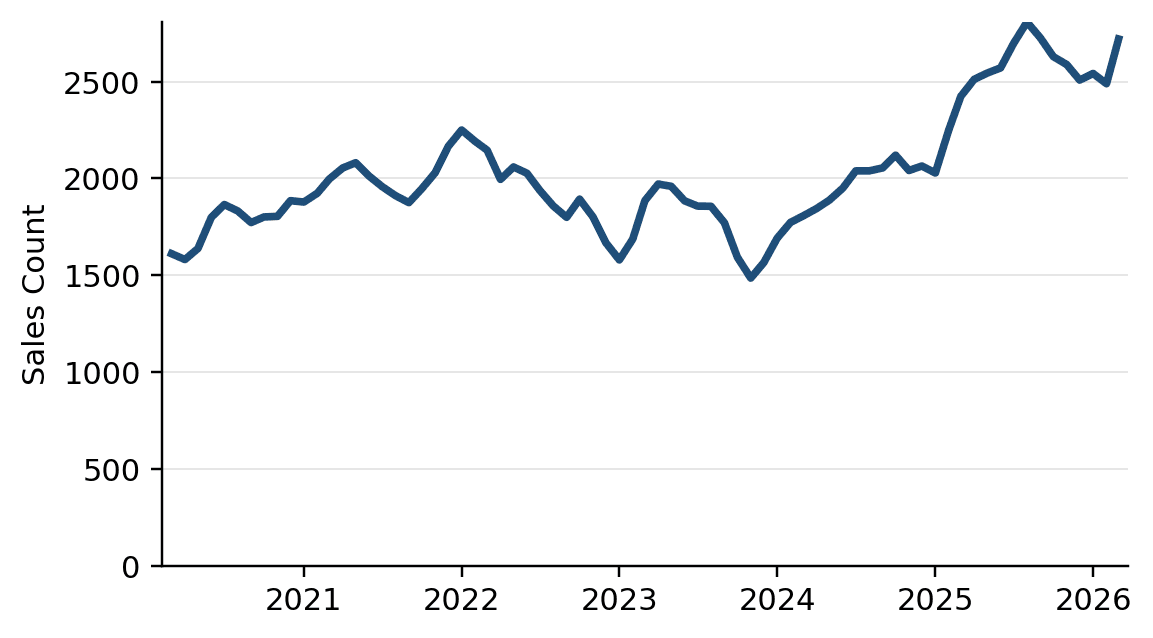
Market activity, however, remained stable. The 12-month liquidity measure stood at $63 million, indicating that transaction volume across the defined universe has held steady despite mixed price movements.
Taken together, the March data suggest a market that is not in retreat but undergoing gradual rebalancing. Price movements are no longer uniform across segments, and dispersion is increasing, while overall participation remains intact.