
A structured benchmark designed to track price movements across key segments of the secondary domain market, with subscriber-only interpretation of internal structure, relative performance, and emerging directional signals.
March was stable at the headline level, but internally the market remained highly uneven, with low-volatility Broad performance contrasting sharply with the much higher-risk behavior of Tech and Top 1.
.COM+ continues to anchor overall market structure, contributing the large majority of breadth, while Tech remained the strongest segment but also the most liquidity-sensitive and volatile.
Liquidity remains supportive, but widening dispersion across volatility, drawdown, and breadth contribution confirms that the market is selective rather than uniformly strong.
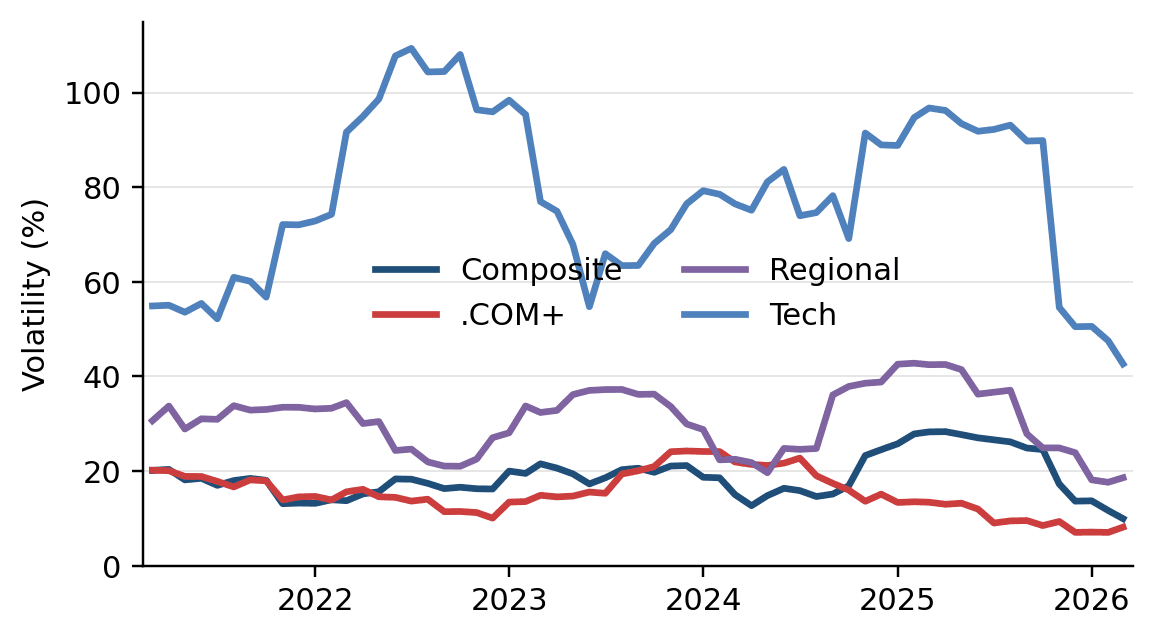
Broad remained the most stable segment in the system, with the lowest volatility and shallowest historical drawdown among the tracked price indices.
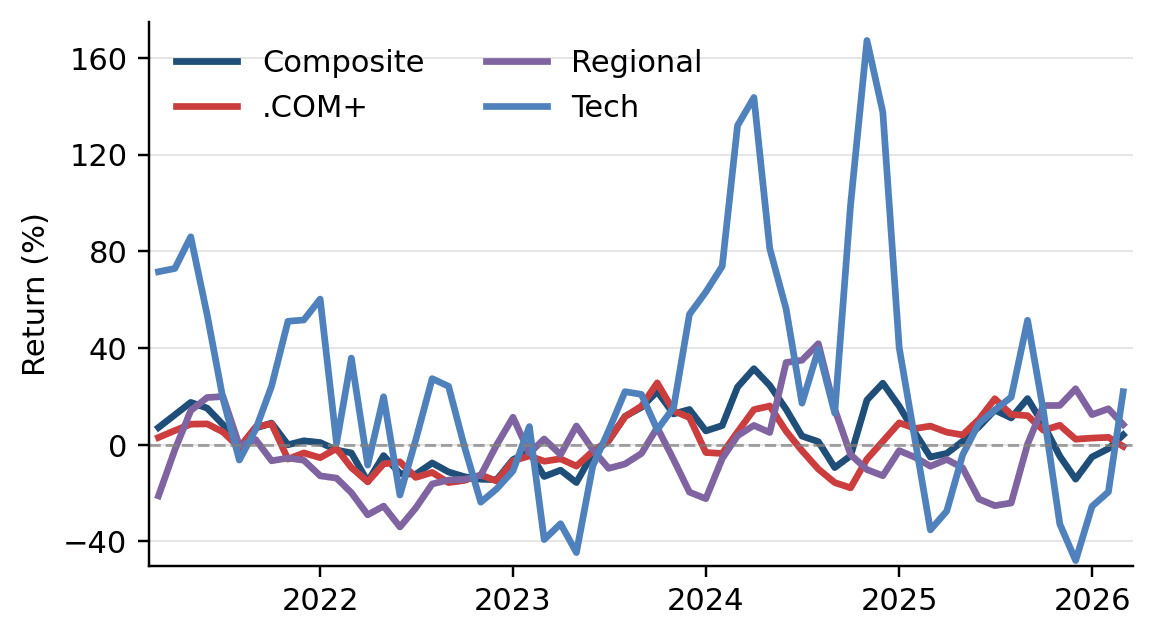
Tech continued to lead on both monthly and annual performance, but its very high volatility and strong liquidity sensitivity confirm that this strength is cyclical rather than defensive.
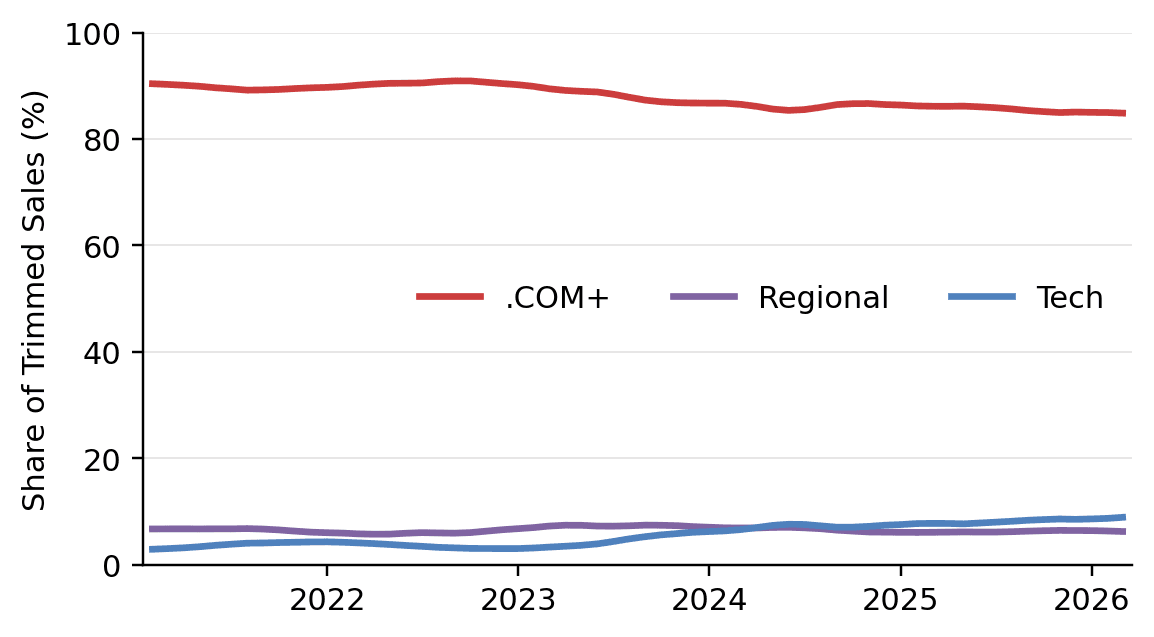
.COM+ remained the dominant structural core of the market, contributing 83.46% of last-month breadth and continuing to provide the primary foundation of transaction participation.
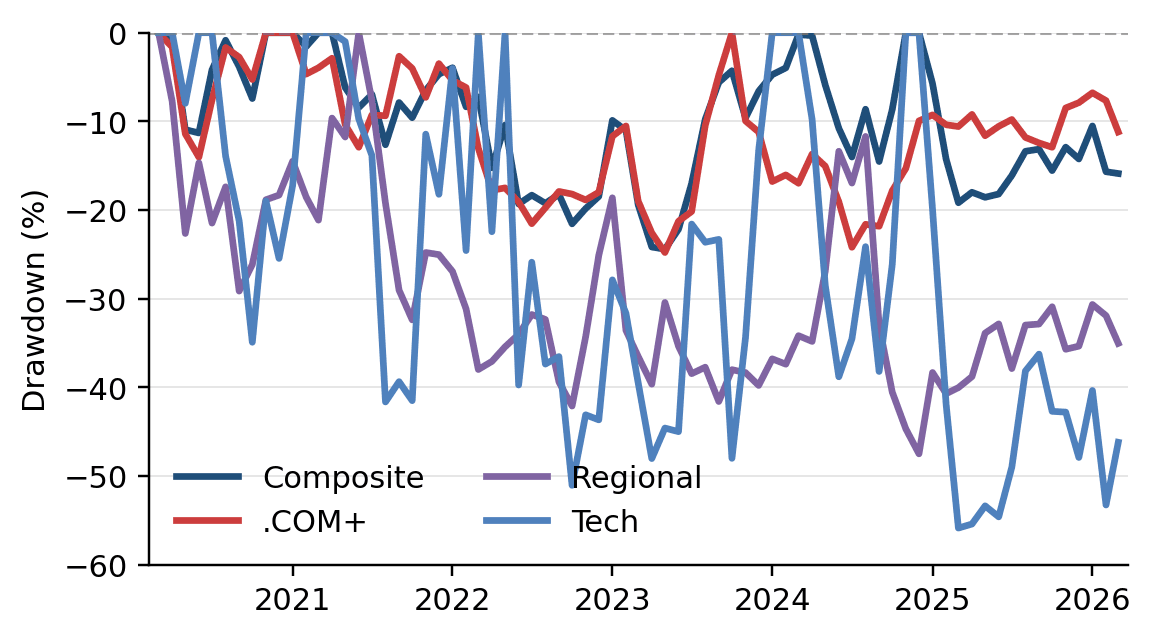
Regional remained weaker structurally, with a deep historical drawdown and negative liquidity sensitivity, indicating less reliable buyer depth and a less stable response to improving market conditions.
Top 1 continued to show extreme instability, with exceptionally high volatility and the deepest drawdown in the index family, reinforcing its limited usefulness as a signal of broad market health.
Executive Summary — March 2026
The subscriber edition extends the public release with deeper interpretation of internal divergence, segment leadership, and structural signals not visible in the headline index alone.
This subscriber edition includes additional structural interpretation beyond the public release. A deeper professional tier with expanded time-series, decomposition, and signal analysis may follow.
Performance Table
Index base: March 2020 = 100. The subscriber table extends the public release by adding medium- and longer-horizon performance measures for each tracked segment.
In addition to current index levels, prices, and short-term returns, this edition includes 3-year, 5-year, and since-inception annualized performance to help distinguish temporary monthly noise from deeper structural leadership and relative durability.
| Series | Index | Price | 1M | 12M | 3 Year | 5 Year | Since Inception |
|---|---|---|---|---|---|---|---|
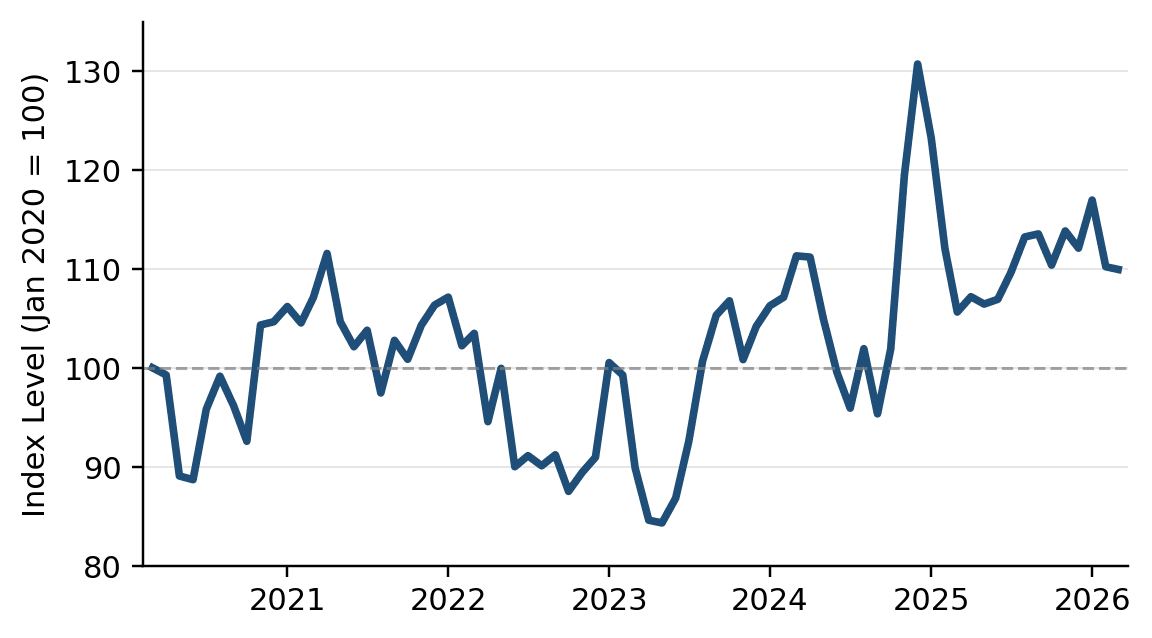
| VMDI Composite | 109.95 | $6,077 | -0.24% | 4.08% | 6.95% | 0.52% | 1.59% |
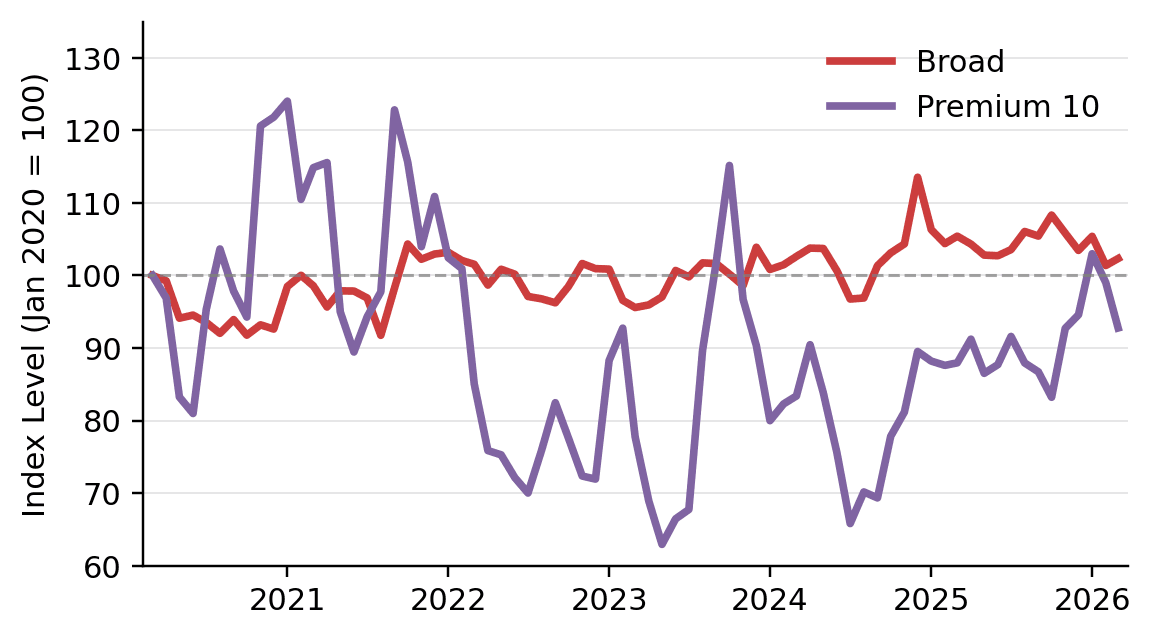
| VMDI Broad | 102.33 | $3,554 | 0.95% | -2.92% | 2.30% | 0.75% | 0.39% |
| VMDI Premium 10 | 92.76 | $37,169 | -6.31% | 5.47% | 6.05% | -4.18% | -1.24% |
| VMDI .COM+ | 97.81 | $5,485 | -3.82% | -0.68% | 4.04% | -1.03% | -0.37% |
| VMDI Regional | 66.23 | $4,342 | -4.60% | 8.33% | 0.77% | -3.43% | -6.64% |
| VMDI Tech | 259.44 | $11,186 | 15.12% | 21.92% | 22.37% | 8.63% | 17.22% |
| VMDI Top 1 | 136.01 | -28.65% | -31.76% | 3.24% | -8.57% | 5.26% | |
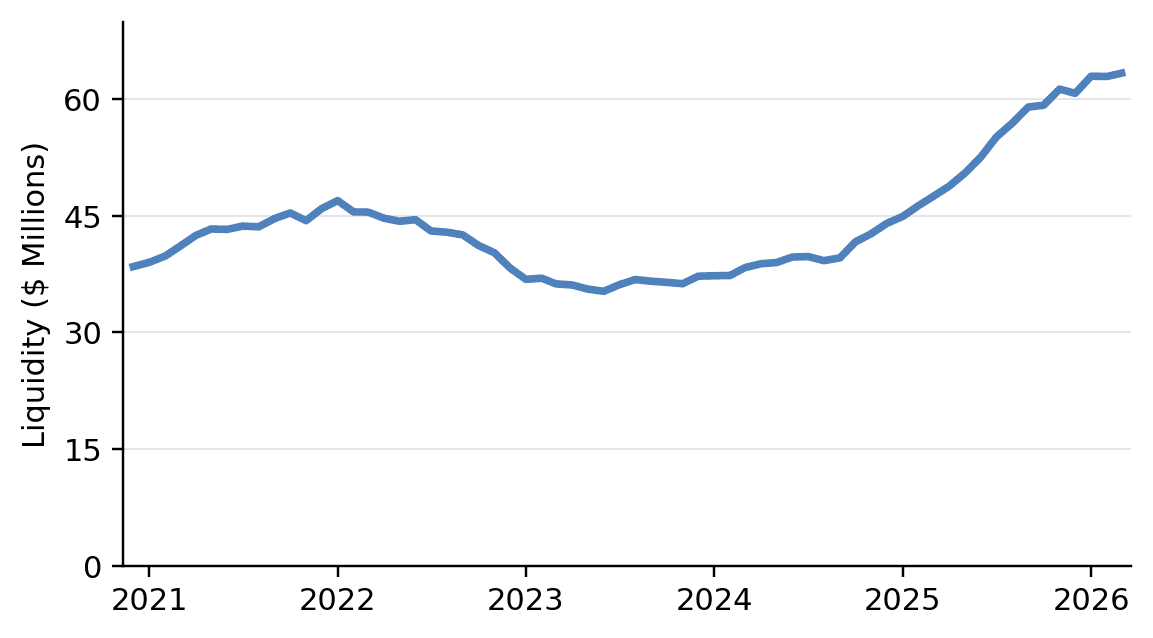
| VMD Liquidity Measure | $63 | 0.67% | 33.36% | 20.47% | 9.06% | 9.97% |
- Price means implied average price in US$.
- Base value = 100 at inception date: March 2020.
- Universe: ≥$2,000 sales, lengths 5–12, alpha-only, Top 1% excluded.
- Groups: .COM+, Regional, Tech.
- Length-normalized with equal weight per length bucket.
- Minimum 5 transactions per length required.
- Composite: weighted by predefined group weights (.COM+: 80%; Regional: 8%; Tech: 12%).
- VMD Liquidity Measure: past 12-month total dollar volume of domain sales in the index universe.
Risk and Market Structure Metrics Table
As of March 2026. This table extends the public release by showing risk behavior, downside profile, internal market breadth, and historical liquidity sensitivity across the major VMDI series.
Unlike simple return snapshots, these measures are intended to show how each segment behaves internally. Volatility and drawdown describe the stability and downside history of each index, while breadth and liquidity sensitivity provide a clearer view of structural participation and dependence on broader market turnover.
| Series | Volatility (ann.) | Max Drawdown | Breadth Cont'n (last month) | Breadth Cont'n (rolling 12 M) | Liquidity Sensitivity |
|---|---|---|---|---|---|
| VMDI Composite | 18.64% | -24.42% | N/A | N/A | 0.44 |
| VMDI Broad | 9.80% | -10.72% | N/A | N/A | 0.24 |
| VMDI Premium 10 | 35.45% | -49.27% | 8.35% | 8.35% | 0.81 |
| VMDI .COM+ | 15.84% | -24.80% | 83.46% | 83.46% | 0.32 |
| VMDI Regional | 30.23% | -47.50% | 6.47% | 83.46% | -0.61 |
| VMDI Tech | 74.16% | -55.88% | 10.07% | 10.07% | 1.07 |
| VMDI Top 1 | 251.00% | -86.75% | N/A | N/A | 0.72 |
- Volatility represents the annualized standard deviation of monthly index returns calculated from index inception. Because domain prices follow heavy-tailed distributions, volatility is measured using the index series rather than individual transaction prices.
- Maximum drawdown measures the largest peak-to-trough decline observed in each index since inception and provides an indication of historical downside risk.
- Breadth Contribution (last month) reflects the share of qualifying transactions contributed by the segment in the most recent month relative to total trimmed market sales.
- Breadth Contribution (rolling 12 months) measures the segment’s share of total trimmed market transactions over the last twelve months, smoothing out monthly fluctuations.
- Liquidity Sensitivity measures how strongly an index has historically responded to changes in the Valora Maxima Domain Liquidity Measure. Values near 1.0 indicate movement broadly in line with market liquidity; values above 1.0 indicate stronger sensitivity, while values below 1.0 indicate weaker dependence. Negative values suggest an inverse relationship.
Key Charts
Advanced Analysis
These subscriber charts extend the public release by highlighting medium-term return persistence, downside profile, rolling volatility, and structural participation across the major VMDI segments.
Data & Limitations
The index is derived from publicly available domain transaction data. While every effort is made to ensure consistency and accuracy, the dataset is not exhaustive and may not capture all private transactions.
Subscriber Access: Full multi-year performance metrics and structural analysis are available to subscribers.
Disclaimer
This report is provided for informational purposes only and does not constitute investment advice. The Valora Maxima Domain Index is an independent analytical construct and should not be relied upon as the sole basis for investment decisions.
© Valora Maxima — All rights reserved.