

The resale market for domain names (“the secondary market”) is both fascinating and misunderstood. While headlines trumpet deals like Voice.com at $30 million or Insurance.com at $35.6 million, the vast majority of domain transactions are far smaller.
To truly understand the market, it’s important to look not just at outliers but at the distribution of prices across all .com resales. Thanks to NameBio, which maintains the industry’s largest public database of domain sales, we can sketch a clear picture of how prices are distributed and how they’ve changed over time.
1. About NameBio and Its Methodology
NameBio is a searchable database of historical domain sales, currently containing millions of transactions. It aggregates data from marketplaces (e.g. Sedo, GoDaddy/Afternic, DropCatch, NameJet) and some private brokers.
Crucially:
- Only reported sales are included. Many private or NDA deals are never captured.
- Sales under $100 are excluded. This removes registrar promos, expired auctions at nominal prices, and keeps the dataset focused on true aftermarket trades.
- Data skews slightly high: Because many very low-value investor flips are excluded, the reported median price is typically higher than if you counted every aftermarket sale.
This makes NameBio an excellent lens for understanding end-user demand and serious investor activity, though it doesn’t represent the entire universe of transactions.
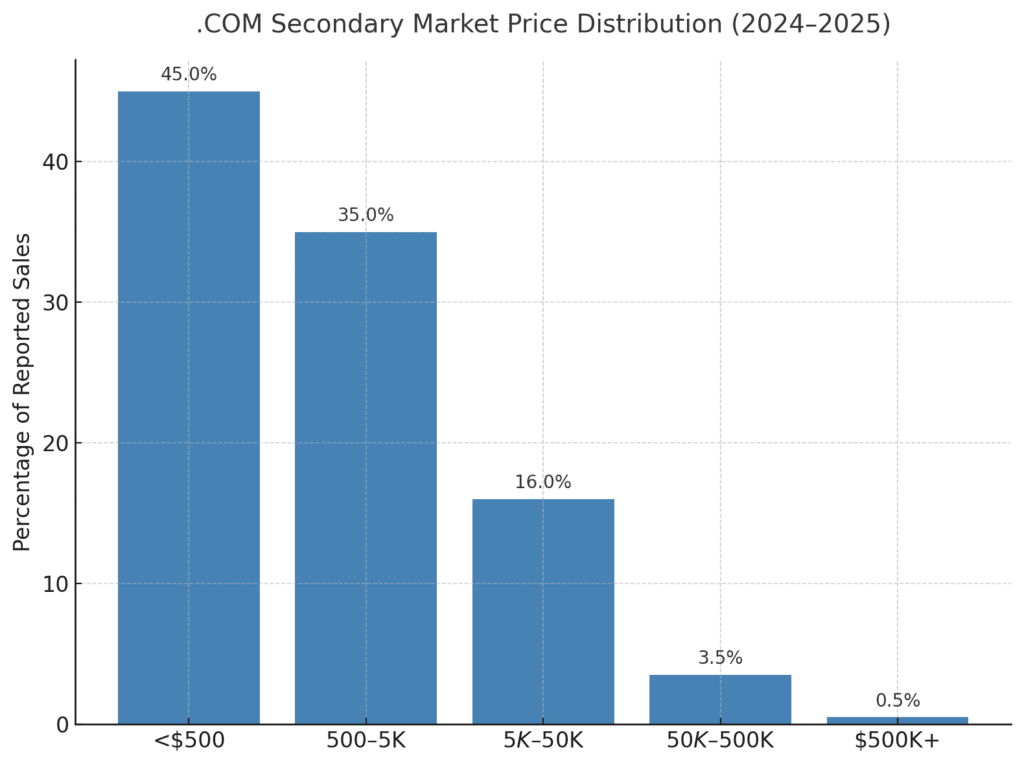
2. What the Distribution Looks Like
NameBio data shows a heavily skewed, Pareto-style distribution:
- Under $500: The largest share of transactions — often investor flips, geo-domains, and long-tail brandables.
- $500–$5,000: The most common range for small-to-medium businesses buying their primary domain.
- $5,000–$50,000: Premium brandables, finance and tech-related keywords, and short dictionary terms.
- $50,000–$500,000: Rare but steady, often category-defining generics.
- $500,000+: Outliers like Voice.com or NFTs.com — less than 0.1% of all sales.
3. How the Distribution Changed Over Time
Using NameBio’s aggregated sales records, here is an approximate breakdown of .com resale activity by price segment over the past two decades:

2005–2010: The Early Boom
- ~60% of sales under $500.
- Median prices in the $1,200–1,500 range.
- Big-ticket deals like Sex.com or Diamond.com were rare outliers.
2011–2015: Professionalization
- <$500 trades fell slightly, ~55% of sales.
- $500–$5K range grew, reflecting more SMB and startup buyers.
- Median prices rose toward ~$1,700–2,000.
2016–2020: Rising End-User Demand
- <$500 sales dropped further, ~50%.
- $500–$5K rose into the mid-30s percent range.
- More five-figure purchases by funded startups.
- Median price: ~$2,200–2,600.
2021–2024: The New Normal
- <$500 fell again to ~45% of sales.
- $500–$5K became the dominant tier for end-user upgrades.
- $5K–$50K continued to grow, especially in finance, crypto, and AI.
- Median price: ~$2,800–3,200.
4. Why the Shift Happened
Several forces reshaped the aftermarket:
- Market maturity: Investors now price quality names higher; cheap flips are less common.
- Startup funding boom: VC-backed companies regularly spend $10K–50K on their .com.
- Category scarcity: Most top one-word .coms are taken, pushing buyers into higher ranges for two-word brandables.
- New trends: Web3, crypto, and AI drove temporary spikes in demand for related keywords.
5. Key Takeaways
- The median .com resale price has steadily risen from ~$1,500 in the mid-2000s to nearly $3,000 today.
- Most sales still happen under $5K — but the share of mid-tier ($5K–$50K) sales is rising.
- The outliers are real but rare: Million-dollar domains exist, but they are <0.1% of all trades.
- .COM remains dominant: While .ai and .xyz create hype, high-value sales are overwhelmingly in .com.
- Distribution reflects maturity: As the aftermarket professionalized, more deals shifted upward from “sub-$500 flips” to serious end-user purchases.
Conclusion
The secondary market for .com domains is like a pyramid: wide at the base, narrow at the top. The vast majority of sales are modest, but the very peak of the market proves the enormous brand power of a single, premium .com.
Thanks to NameBio’s reporting, we can see the market’s evolution: fewer cheap trades, more mid-tier end-user purchases, and a rising median price. For investors, the sweet spot has shifted from chasing quick flips under $500 to targeting domains that can realistically sell for $2K–$25K — where most of today’s liquidity lies.